DEF-040 — Safety Alerts: Reports count column shows blank despite data being present in DOM
DEF-040 — Safety Alerts: Reports count column shows blank despite data being present in DOM
Summary
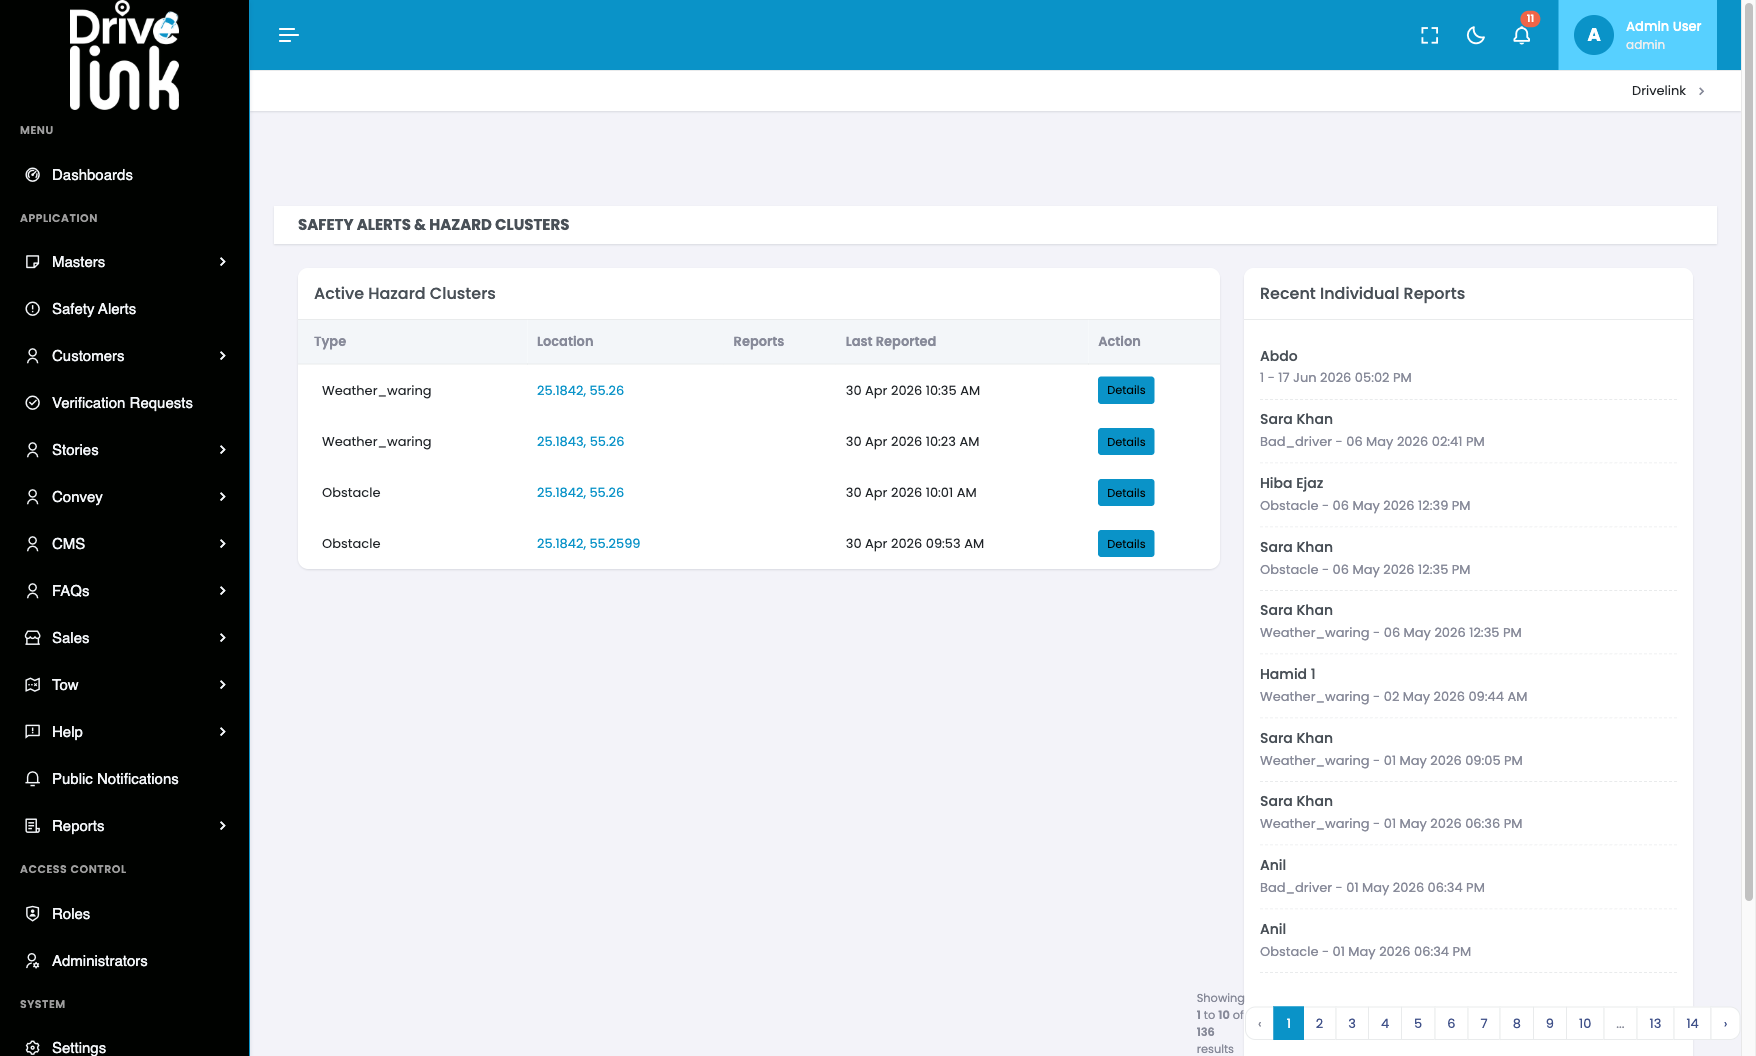
The Reports column in the Active Hazard Clusters table on the Safety Alerts page appears visually blank for all rows. However, the data is present in the DOM — querying the table cells returns the correct count (“2” for each cluster). The value is rendered as invisible text, likely due to a CSS colour conflict (e.g. white text on a white/light background, or font-size: 0).
Environment
- URL:
https://project6.dxtserver.com/drivelink_new/public/admin/safety-alerts - Module: Admin Panel — Safety Alerts → Active Hazard Clusters table
- Date Reported: 2026-06-17
- Browser: Chromium (Playwright)
- Testing Phase: Admin Panel — Section 3: Safety Alerts (test case SA-02)
Screenshots
Safety Alerts list page — Reports column appears blank for all 4 clusters:
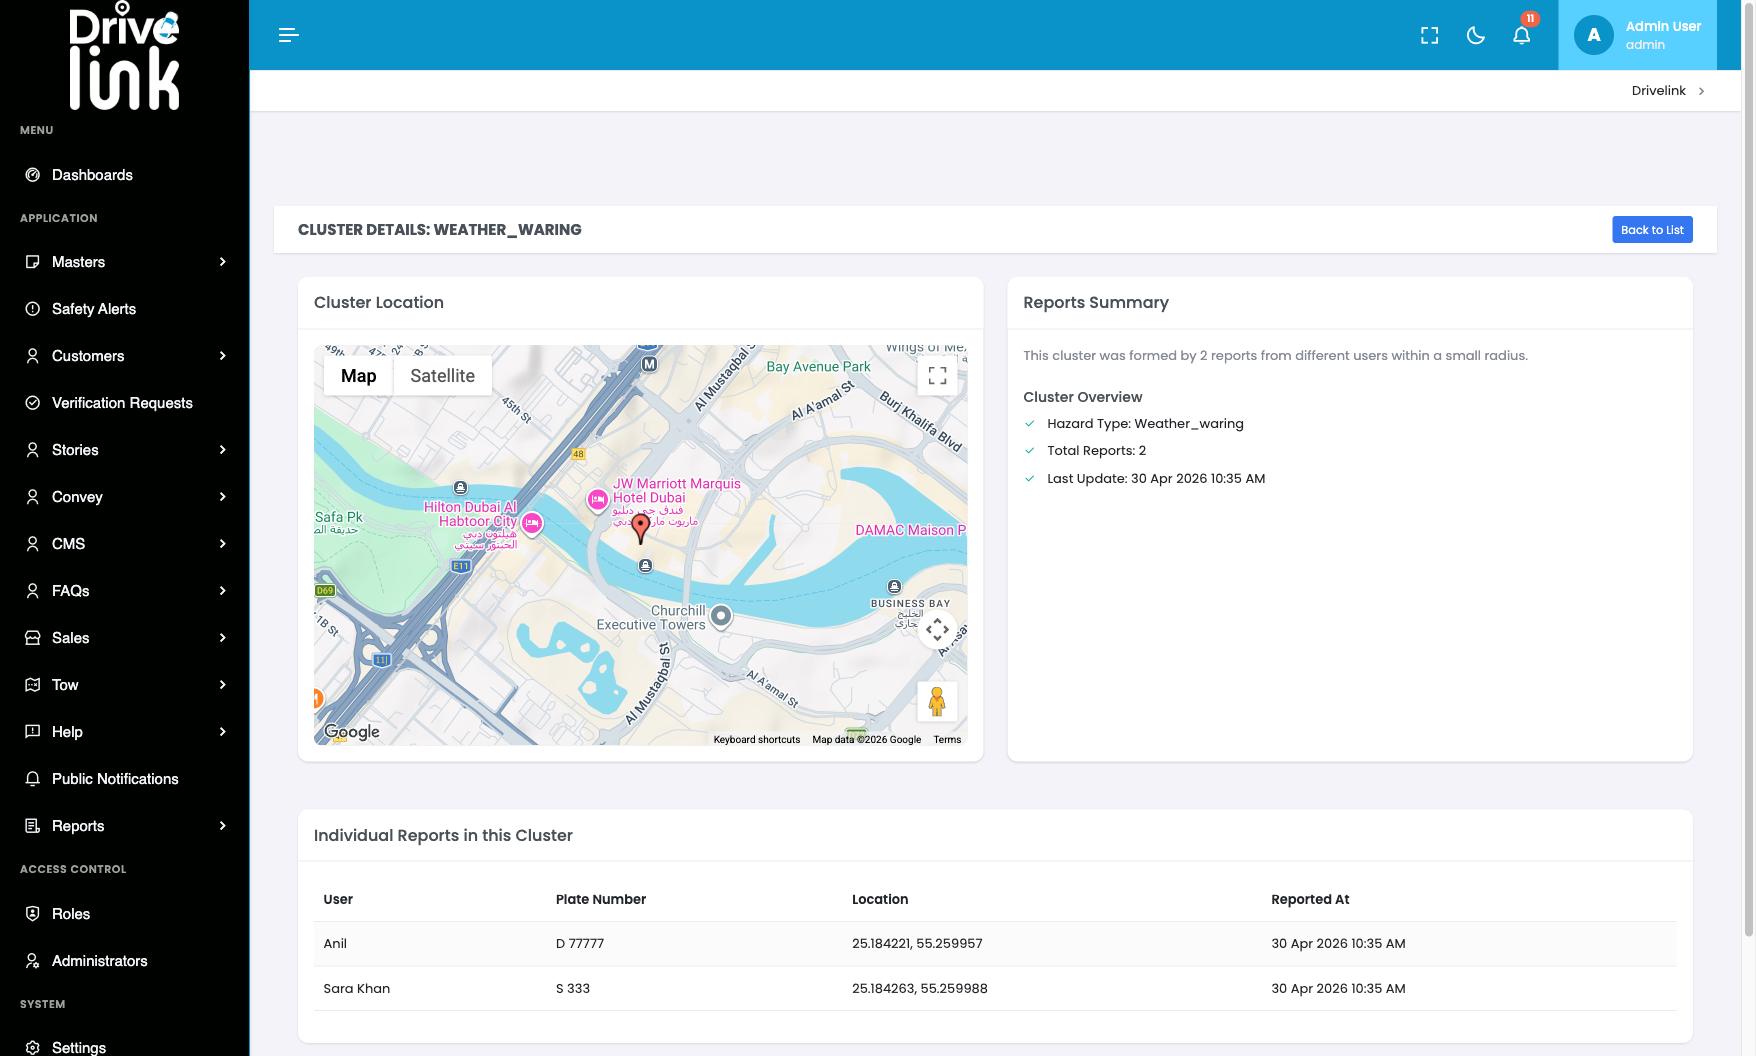
Cluster detail page — “Total Reports: 2” confirms the data exists and is correct:
Steps to Reproduce
- Log in to the Admin Panel.
- Navigate to Safety Alerts (
/admin/safety-alerts). - Observe the Active Hazard Clusters table on the left side.
- Look at the Reports column — all cells appear empty.
- Open browser DevTools and inspect the Reports cell element — the value “2” is present in the DOM.
Evidence from DOM
JavaScript query on the table confirmed the value exists:
table cell[index=2] = "2" (for all 4 cluster rows)The cluster detail page (/admin/safety-alerts/4) also confirms: “Total Reports: 2” — consistent with the invisible DOM value.
Expected Behaviour
The Reports count should be visible in the table cell, showing a number such as “2” for each cluster row.
Actual Behaviour
The Reports column cells appear blank/empty on screen despite containing the correct numeric value in the DOM. This is a CSS rendering issue — the text colour likely matches the background colour for that column.
Impact
- Admins cannot see at a glance how many individual reports make up each hazard cluster
- The Reports count is a key metric for triaging which clusters need the most urgent attention
- Admins must click into each cluster’s detail page individually to find the report count
Severity
Medium — Data is present but not visible; admins must navigate deeper to find information that should be immediately visible in the list.
Priority
Medium
Status
New
Reported By
QA / Testing Team